Cross Over Project :: Dashboard
Ironhack UXD Bootcamp Midterm Project:
Visualization of the database "Arctic Mammals" from the bootcamp course "Data Analyst" using the Design Thinking process.
This database collected data on the migration of Arctic mammals and also climatic changes in the region. By intersecting this data, it became clear that there is a correlation between latitudes and temperatures: The animals were moving closer and closer to the North Pole each year, at the same time as temperatures at their previous locations were continuously rising.
The database comprised around 20 different Arctic mammals, their summer and winter habitats and temperature trends over the past 20 years.
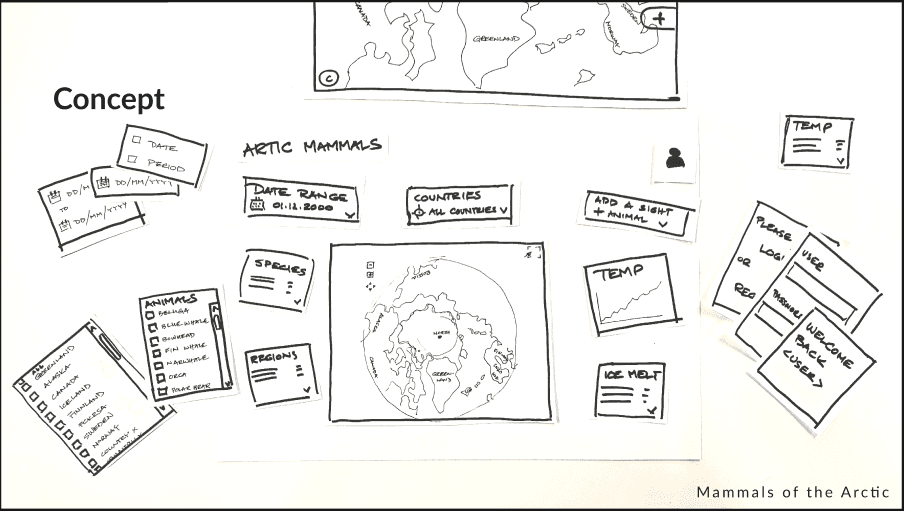
A time frame of two weeks was set for the realization of this project. After research, ideation and testing of the rough and fine concepts, an executable prototype was to be created.
While researching this project, I came across the Polar Citizen Science Collective. A non-profit organization that, as part of its polar research work, is also in contact with travel companies that offer tours or cruises to the Poles.
In addition to the environmentally critical aspects of these tours, the tour participants also offer a previously unused opportunity to collect data about the regions visited. This organization was therefore ideally suited as the fictitious publisher of this dashboard.
High Fi Prototype

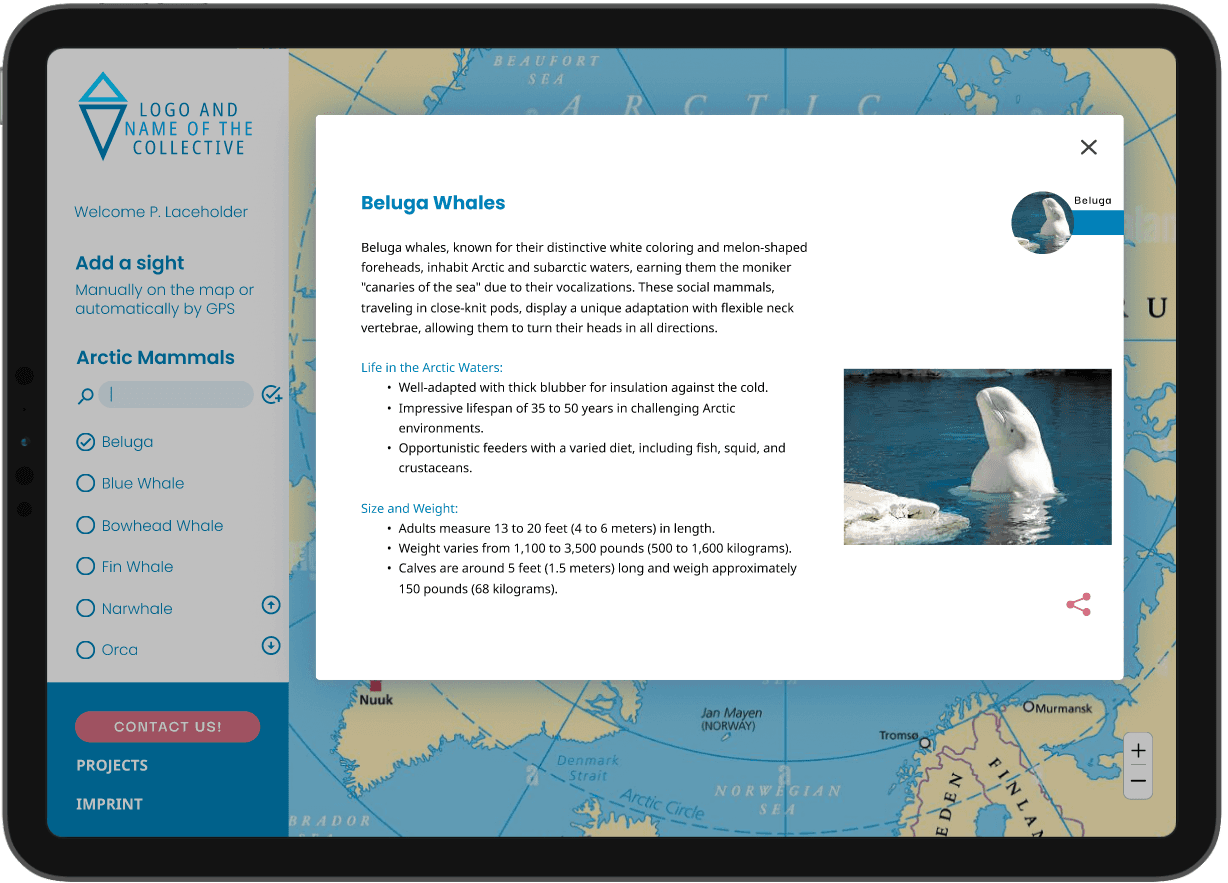
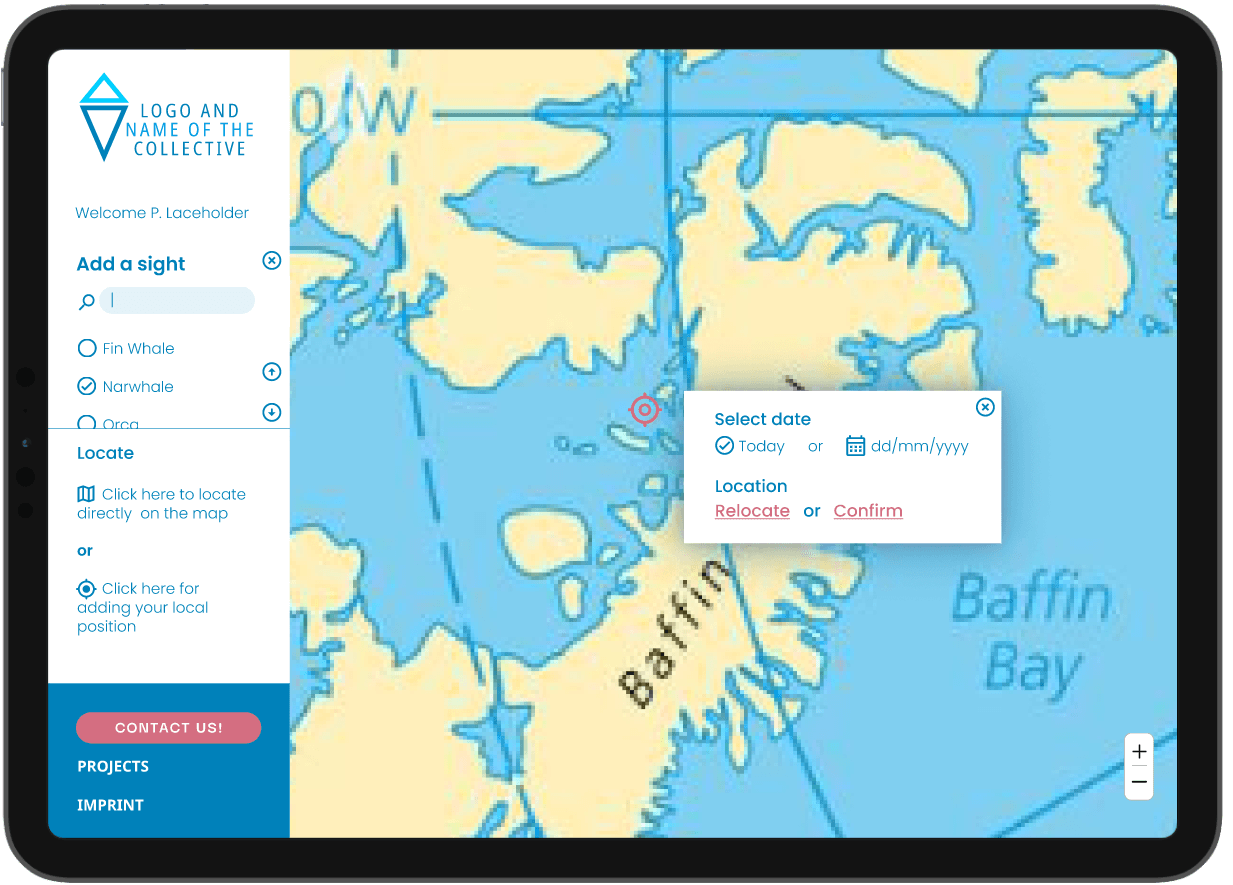
Additions to the animal register
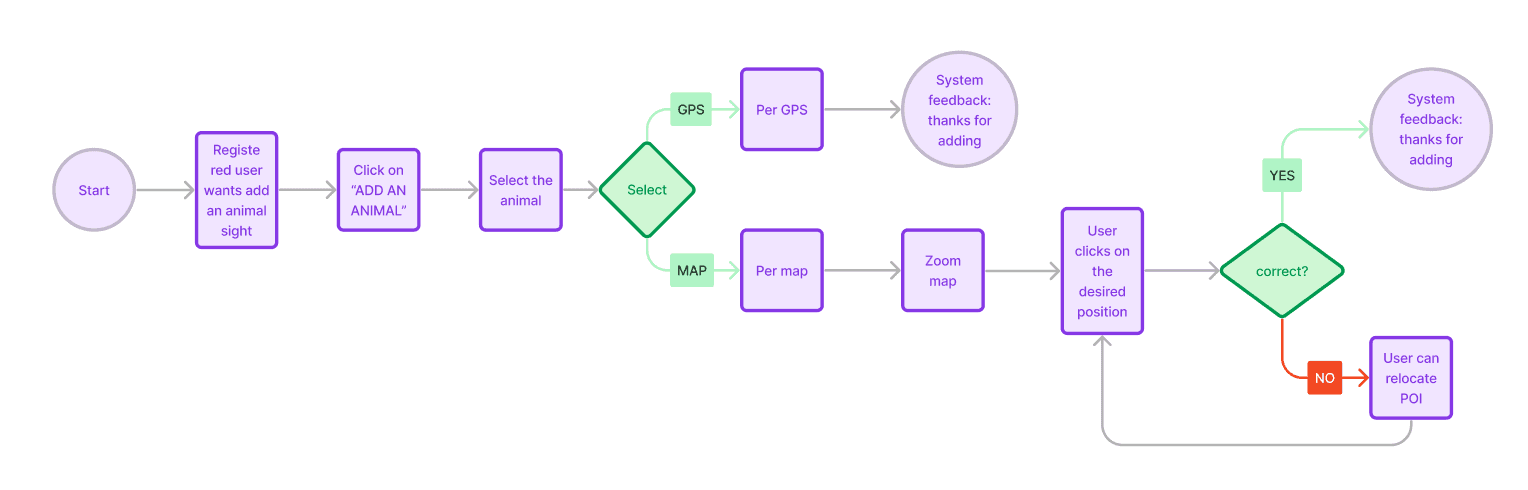
The scientific participation of travelers takes place through the entry of animal sightings. Registered or logged-in users can enter individual animals or animal schools or herds manually via the map or automatically via the device's GPS in the system.
If several travelers on a tour use the system, the data entered can be verified.